“If something is too hard, we move on to something else.
What could be simpler than that?”
–Charles T. Munger
A Look Back
In 2022’s 4th-quarter letter, we wrote that:
[although] the economic backdrop is bleak, featuring headwinds such as a war in Europe, a hawkish Federal Reserve, geopolitical tensions with China, dysfunction in Washington, and uncertainty about China’s COVID-19 reopening, reasons for optimism remain. We have found that during times of uncertainty, investing in high-quality companies that are selling at reasonable valuations, with catalysts for capital appreciation, has been a sound strategy. We see no reason this time should be any different. Although we don’t have a crystal ball to tell us when (or if) a recession will begin, or how long one might last, markets have historically delivered strong performance in the wake of (and often during) economic downturns—so we urge investors to stay the course (emphasis added).
Last year was a textbook case of why stock market investors are often better off ignoring geopolitical noise and market prognosticators: Going into 2023, the consensus among Wall Street strategists was that a recession was imminent and that the S&P would advance a mere 6%. Not many people would have predicted that during a year featuring a regional banking crisis, a debt ceiling standoff, ongoing war in Ukraine, a new war in the Middle East, and a continuation of rate hikes that pushed the Fed funds rate to its highest level in 22 years, GDP would increase, unemployment would reach its lowest level since 1969, and the stock market (as measured by the S&P 500) would advance 24%. If investors had moved to the sidelines waiting for the “right” moment to invest in the stock market, they would have missed out on handsome gains.
The consensus turned out to be just as wrong as it had been heading into 2022, when strategists urged investors to pile into technology stocks, which they believed would be insulated from interest rate increases. Instead, in 2022 the tech-heavy Nasdaq ended up declining 33%. With that in mind, investors should take this year’s rosy consensus forecast for both the economy and the stock market with a sizable grain of salt!
State of the Market
After its longest weekly winning streak since 2004 (gains for 9 straight weeks, until 2024’s first week of trading ended the streak), the S&P 500 ended 2023 selling for 19.5x (fwd.) earnings—an elevated valuation by historical standards. (The 30-year average is 16.6x.) According to Adam Turnquist of LPL Financial, since 1950 the S&P 500 has posted average and median 12-month returns of 8.1% and 12.2% following other 9-week winning streaks.
The S&P 500 index level (4,770 as of December 31, 2023) is slightly lower than it was roughly 2 years ago, on January 3, 2022, when it stood at 4,797, but it currently trades at a lower multiple of earnings (19.5x fwd. vs. 21.4x fwd.). Interestingly, says Nicholas Jasinski, writing for Barron’s, 2023 was the first year since 2012 when the S&P 500 failed to close at a record high even once. (On the last trading day of 2023, it closed less than 1% percent from its all-time high.) While 19.5x is an elevated multiple, back in March 2000 the S&P 500 traded for 25.2x (before losing 49% of its value over the following 2 calendar years). It is worth noting that the S&P 500 equal-weighted index currently sells for a more modest 15.7x (fwd.).
Market Concentration
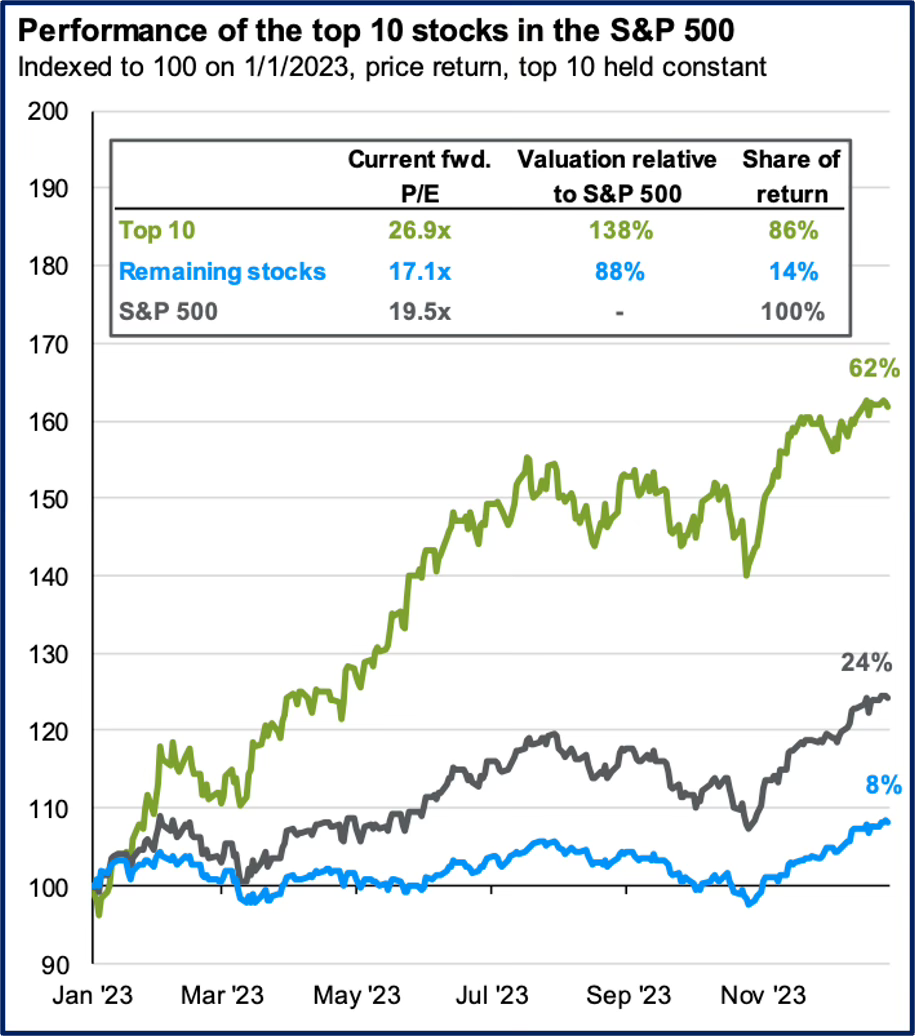
We’re concerned about the valuation of certain parts of the market, especially the stocks that Wall Street thinks will be the big winners in AI. As of December 31, 2023, the 10 largest stocks by market capitalization in the S&P 500 were selling for 26.9x earnings (fwd.), against an average valuation (for the index’s 10 largest stocks) of 20.2x since 1996. What’s more, they currently sell at a multiple 38% higher than the rest of the market, and their weightings (at 32% of the S&P 500) are at multidecade highs. The stocks outside the top 10 aren’t cheap, either, at 17.1x earnings (fwd.) against an average of 15.7x since 1996, but they currently sell at a 12% discount to the overall market.
The S&P 500’s advance in 2023 was far from democratic. The first 10 months of the year’s gains were fueled by a small handful of stocks, many of which made up the so-called Magnificent Seven. In November the rally started to broaden, but even so, more than two-thirds of the stocks in the S&P 500 returned less than the index during 2023. The top 10 stocks in the S&P 500, which account for a staggering 32% of the index, were responsible for 86% of the S&P 500’s gains in 2023.
Reversal of Fortune
Notably, in 2023 three sectors increased by more than 40%, with technology, the top performer, advancing 58%. Despite their negative return in 2023, energy shares, which fell 1.3% during 2023, are still the best-performing sector since the February 2020 stock market low, having dramatically outperformed all other sectors with an advance of 317% (although that figure is relative to an extremely depressed oil price, which even turned negative in April 2020). The next-best performer was technology, at 184%, and the worst performer was utilities, whose 60% advance significantly underperformed the S&P 500’s increase of 127%. However, investors thinking that energy’s 2023 loss is a buying opportunity should recall that energy shares have been a perennial underperformer over longer periods, with the Energy Select Sector SPDR ETF (XLE) producing a modest 39% total return (-6% excluding dividends) versus 213% (+159%) for the S&P 500 over the past 10 years. For reasons such as these, we have historically tended to avoid commodity-dependent stocks, and we will continue to do so.
In 2022 only 2 of the 11 S&P 500 sectors increased in value (with energy up 66% and utilities up a meager 1.6%). In 2023 the market did an about-face, with energy (down 1.3%) and utilities (down 7.1%) the only 2 sectors in the red.
Interestingly, the fortunes of major asset classes also reversed from 2022 to 2023: In 2022 the best-performing major asset class was commodities (up 16%), followed by cash (up 1.5%); all other major asset classes produced negative returns. But in 2023 commodities were the worst-performing asset class (down 7.9%), followed by cash (up 5.1%). In fact, according to JP Morgan, since 2009 commodities and cash have been the worst-performing asset classes on an annualized basis (with cash returning 0.8% and commodities declining by 0.2%).
Did I Miss the Rally in Stocks?
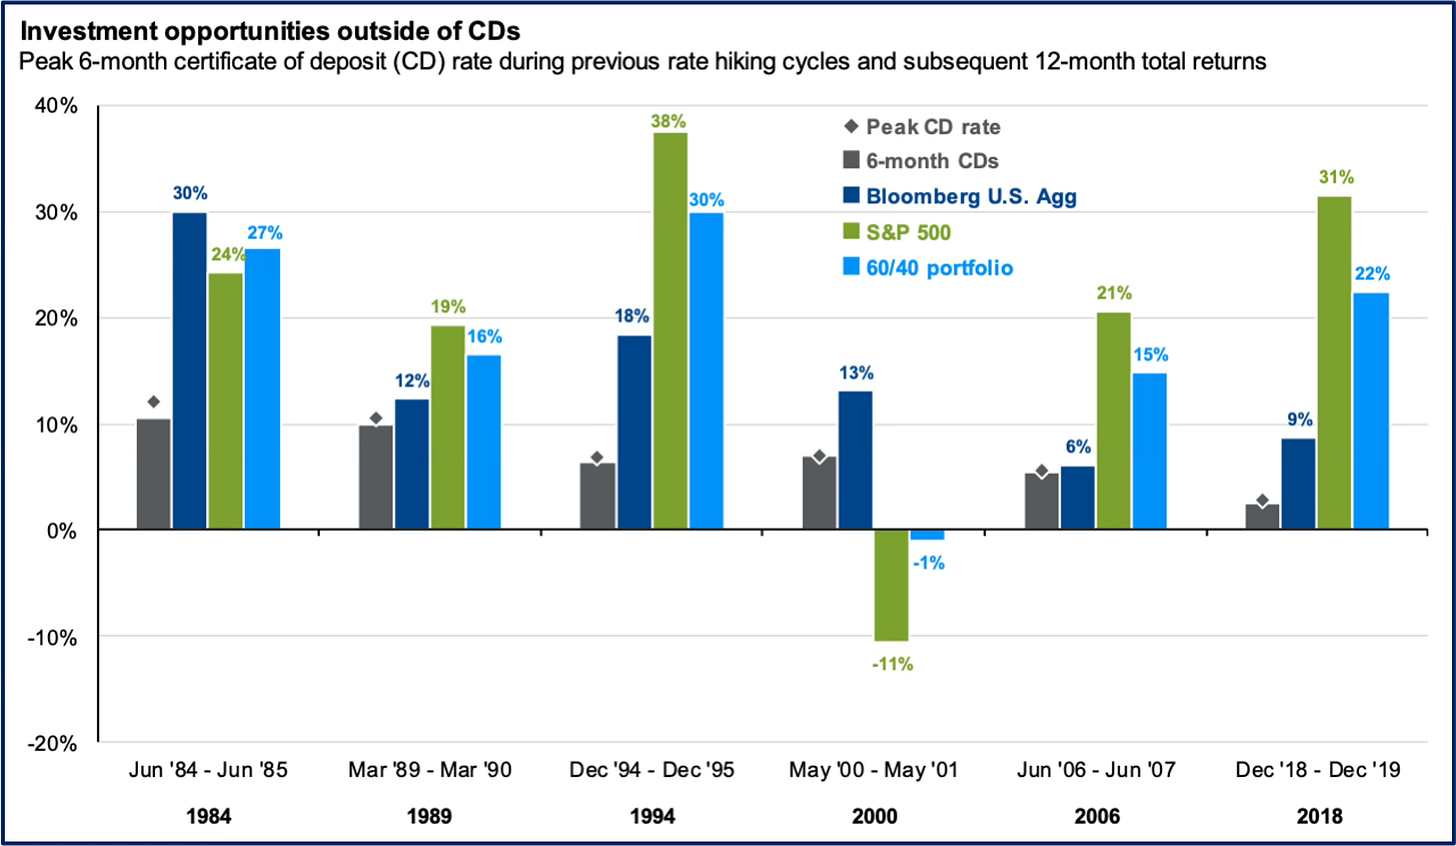
After a large 2023 rally in U.S. equities, many investors (both professional and individual alike) might feel as if they have missed their chance for outsized gains, which could tempt them to keep cash in money market funds where they can currently obtain yields of 5% while taking minimal risk. After all, that’s a fair bit better than the near 0% rates that savers became accustomed to in recent years.
However, investors thinking of pursuing this strategy should keep in mind that over a 2-year period, the Dow Jones Industrial Average is up just 3% (as of the first trading session in each respective year) while the S&P 500 is actually down 1% (for now, the first trading session in 2022 remains the S&P 500’s all-time high-water mark), so equities are pretty close to where they started 2022. In addition, if history is any guide and rates have in fact peaked, we could be in for near-term equity outperformance. Since 1984 there have been six rate hiking cycles and, according to data from JP Morgan, cash tends to underperform both stocks and bonds the year after rates peak (five out of the last six times). Either way, trying to time the market is usually detrimental to your long-term returns.
Even if the market does reach a new all-time high in the coming days, weeks, or months, that in and of itself should not be a reason to sell. Investors that bailed on equities when the S&P 500 reached a new all-time high in March 2012 (after a more than four-year recovery from the Great Financial Crisis) would have missed out on gains of over 230% since that new high. The opportunity cost becomes even more dramatic when considering longer time frames.
A Wild Ride for Bond Investors
Although the 10-year Treasury started and ended 2023 at 3.88%, the devil is in the details, as its virtually flat year-end finish conceals a volatile year of ups and downs. The 10-year Treasury touched 3.25% amid the regional banking crisis in the spring only to briefly surpass 5% (fueled by stronger-than-expected economic growth and an ever-growing U.S. budget deficit) in the fall. While not as exciting to follow as equities are, the 10-year Treasury is important to monitor, as it strongly influences the rates consumers pay on important items such as mortgages and credit cards.
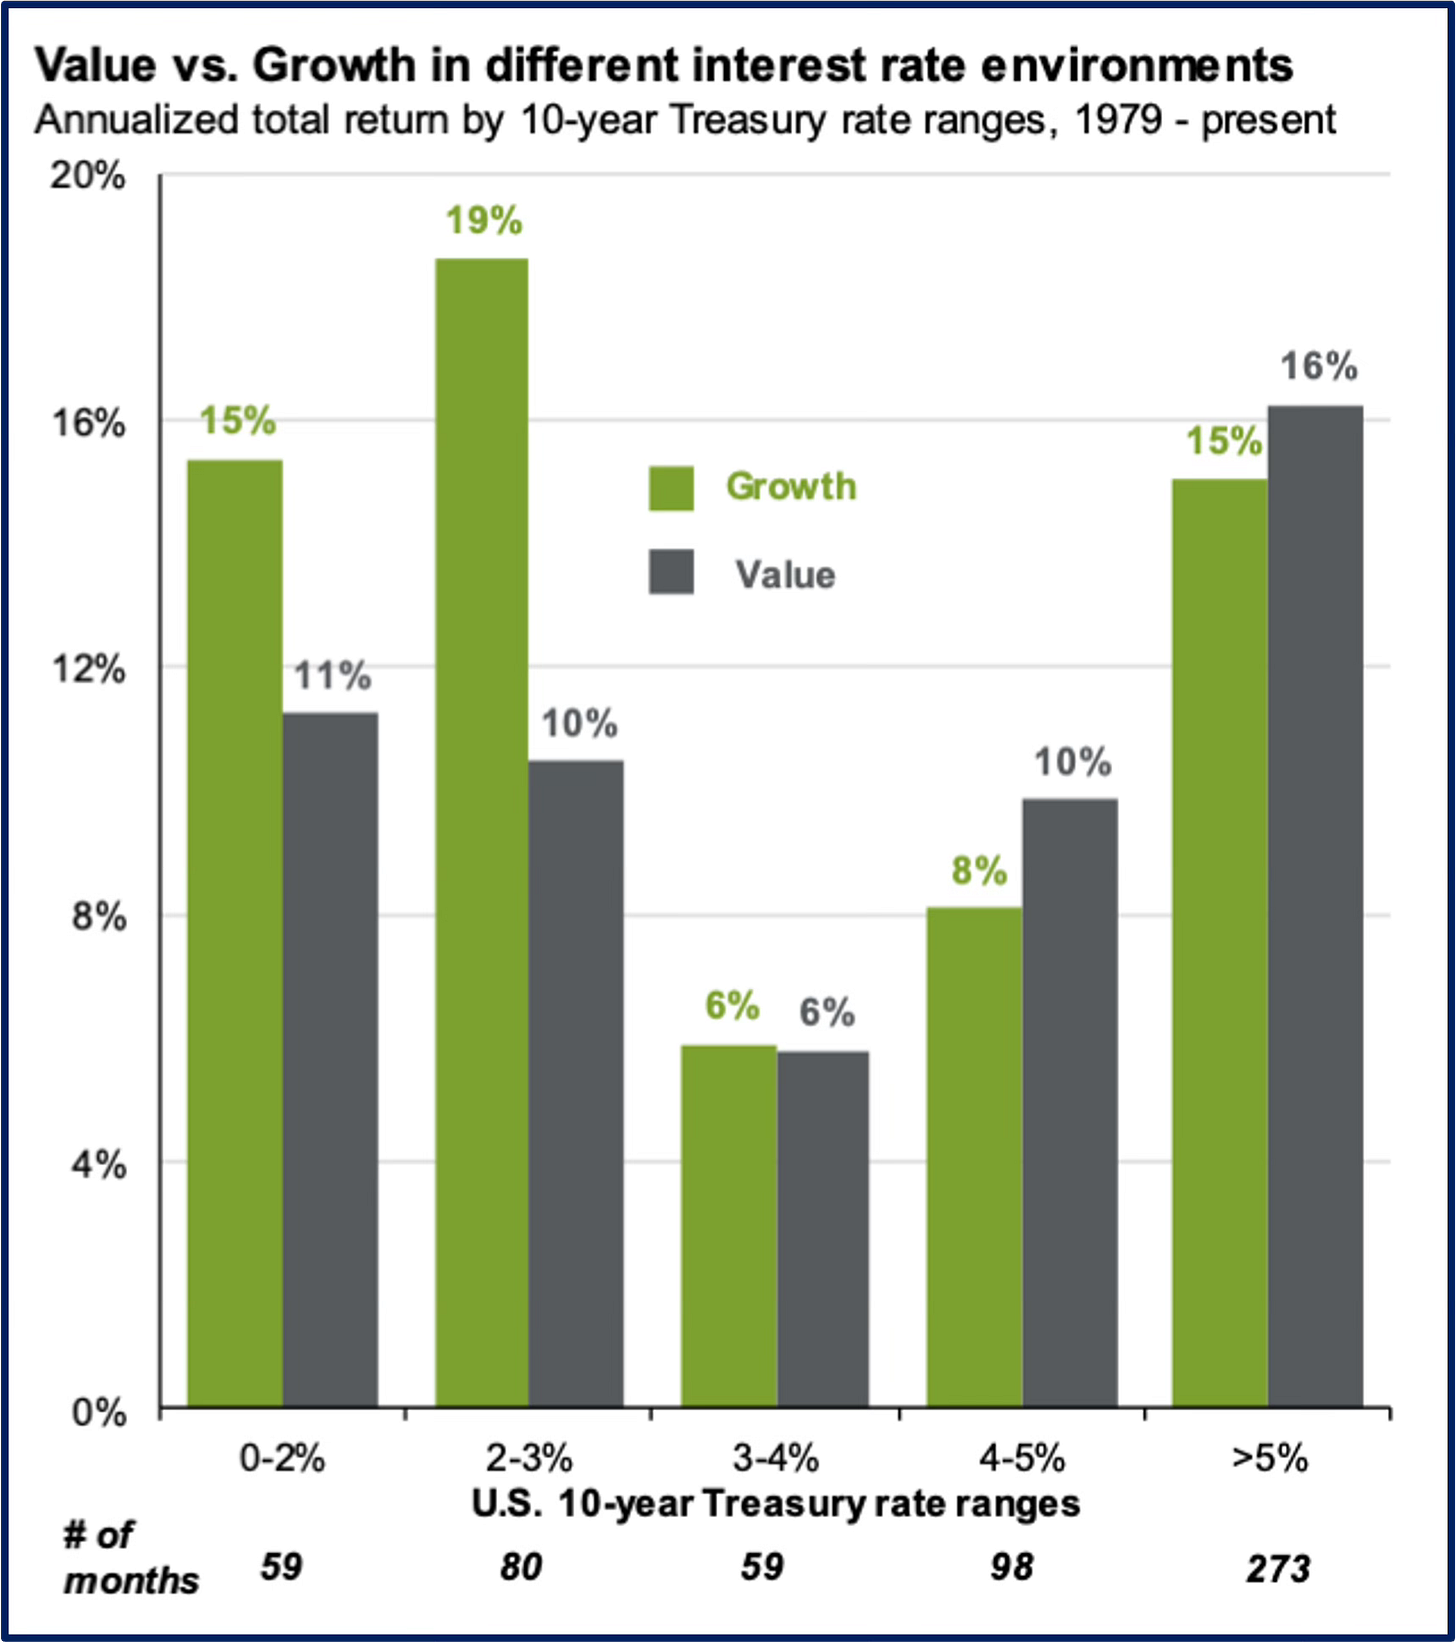
At the time of this writing (mid-January 2024), interest rates (as measured by the 10-year Treasury) yield ~4.11%. But what does that mean for equity investors? According to JP Morgan, since 1979 there have been 98 months when interest rates were 4%-5%. During those times, value stocks’ annualized total return was 10%, versus 8% for growth. In the 59 months when the U.S. 10-year was in the 3%-4% range, both growth and value stocks averaged annualized gains of 6%.
In response to elevated—and not-so-transient—inflation, the Federal Reserve implemented an aggressive rate hiking cycle starting in March 2022, with 11 hikes ranging from 25 bps to 75 bps each, bringing the Fed funds rate from 0.25% to 5.5% in less than 1½ years—the fastest rate hiking cycle since the 1980s. During this span, the 10-year yield surged from under 2.5%, briefly jumping above 5.0% last October. Since then, however, the 10-year’s yield has undergone a sudden retracement as the Fed has paused hiking interest rates, and expectations have shifted to interest rate cuts on the horizon in 2024.
We find it unlikely that the Fed will go back to periods of ultra-low rates like we experienced after the Great Financial Crisis and during the COVID-19 pandemic. The current consensus among most Fed officials is that short-term rates will likely close out 2024 in the 4.5%-5.0% range, and none of them foresees short-term rates going much below 2.5% even over the longer run. Meanwhile, the normalization of 10-year yields above 3% (currently ~4.11%) in combination with elevated growth stock valuations seems to suggest that—in contrast to a long period when growth outperformed value between the Great Financial Crisis and the COVID-19 pandemic, while rates were historically low—value shares may be primed for a durable resurgence.
Too Much Optimism?
Frankly, the levels of optimism we see from professional and individual investors makes us nervous, with Wall Street strategists now predicting both a soft landing and lower interest rates. According to Charley Grant writing for the Wall Street Journal, a December survey released by the American Association of Individual Investors showed that almost half of participants expect the market to rise over the next 6 months. Compare that figure with the start of November (just before the 9-week stock market rally began), when 24% of respondents were bullish and fully half were bearish. Unfortunately, as we’ve so often seen, many investors have the uncanny knack of zigging just when they should be zagging—so monitor this newfound euphoria closely.
Presidential Elections and Stock Market Performance
As we’ve already pointed out, investors are often wise to filter out most geopolitical noise when making investment decisions. But even as fundamentally long-term investors, we would be foolish to completely ignore history, which in Mark Twain’s words doesn’t repeat itself but often does rhyme. With 2024 being a U.S. presidential election year, geopolitics could very well drive the direction of the stock market in the short term, according to the Stock Trader’s Almanac:
Presidential election years are the second-best performing years of the 4-year electoral cycle, having produced losses of greater than 5% in only 6 of the 32 election years since 1896. (But note that in 5 of those 6 years, the incumbent party lost power.)
The stock market, as measured by the S&P 500, does better in years when a sitting president is running, with an average advance of 12.8% since 1949 (vs. an average loss of 1.5% with an open field).
Regardless of which party wins the election, since 1950 the S&P has gained during the last 7 months of the election year in 16 of 18 presidential election cycles.
When the S&P 500 is up from July 31 to October 31 during presidential election years, the incumbent party has retained power 85% of the time since 1936 but has lost control 89% of times when the S&P 500 has declined.
The 2024 presidential election promises to be anything but normal so history may be less instructive this time around. Instead, investors should focus on the companies they own, ideally over a time frame beyond the typical presidential term.
Could 2024 Be the Year of the Small-Cap Stock?
From a valuation standpoint, small-cap value shares are far and away the cheapest part of the U.S. stock market. While large-cap growth shares (led by the Magnificent Seven) are trading ~39% above their 20-year average price/earnings multiple, JP Morgan reports that small-cap value is selling ~2.6% below its 20-year average (a figure that was 14% as recently as November, before small-caps underwent a significant advance). This recent rally has caused the Russell 2000 to emerge from a bear market, but it is still ~14% off its 2021 highs. As Royce & Associates notes, it had been 563 days since the Russell 2000 hit its cycle low—the third-longest the index has gone without reaching its prior peak.
Many factors could help explain the short-term underperformance of small-cap shares (including rising interest rates), but their underperformance isn’t new. Since 2015 the Russell 2000 has significantly underperformed the S&P 500 (by about 6 percentage points a year), even when interest rates were at historic lows. Such protracted underperformance is unusual for small-caps, which historically outperform (or keep up with) larger-cap companies over longer periods. Since 2000, for example, the S&P 500 and the Russell 2000 have performed nearly identically, and from 1926 through July 2023, small-cap value produced an annualized return more than 4 percentage points higher than larger-cap growth, according to the Wall Street Journal.
History suggests that leadership of the stock market could soon pass from large-caps to small-caps—especially if an economic slowdown lies ahead. Over the past 11 recessions, small-caps have beaten their larger cousins by over 16% during the 12 months after a recession started. In the periods before and after the dot-com crash, for example, the S&P 500 outpaced the Russell 2000 by 8 percentage points a year from 1995 to 2000 but lost about 2% from 2001 to 2004 even as the Russell 2000 gained 80%. Beyond favorable valuations, small-cap stocks have the strong dollar going for them, since they tend to outperform during periods of sustained dollar strength. (A strong dollar hurts the competitiveness of U.S. exports while lowering the dollar value of international earnings, thereby hurting large multinational U.S. companies, while small-cap companies typically have a much greater reliance on domestic revenues.)
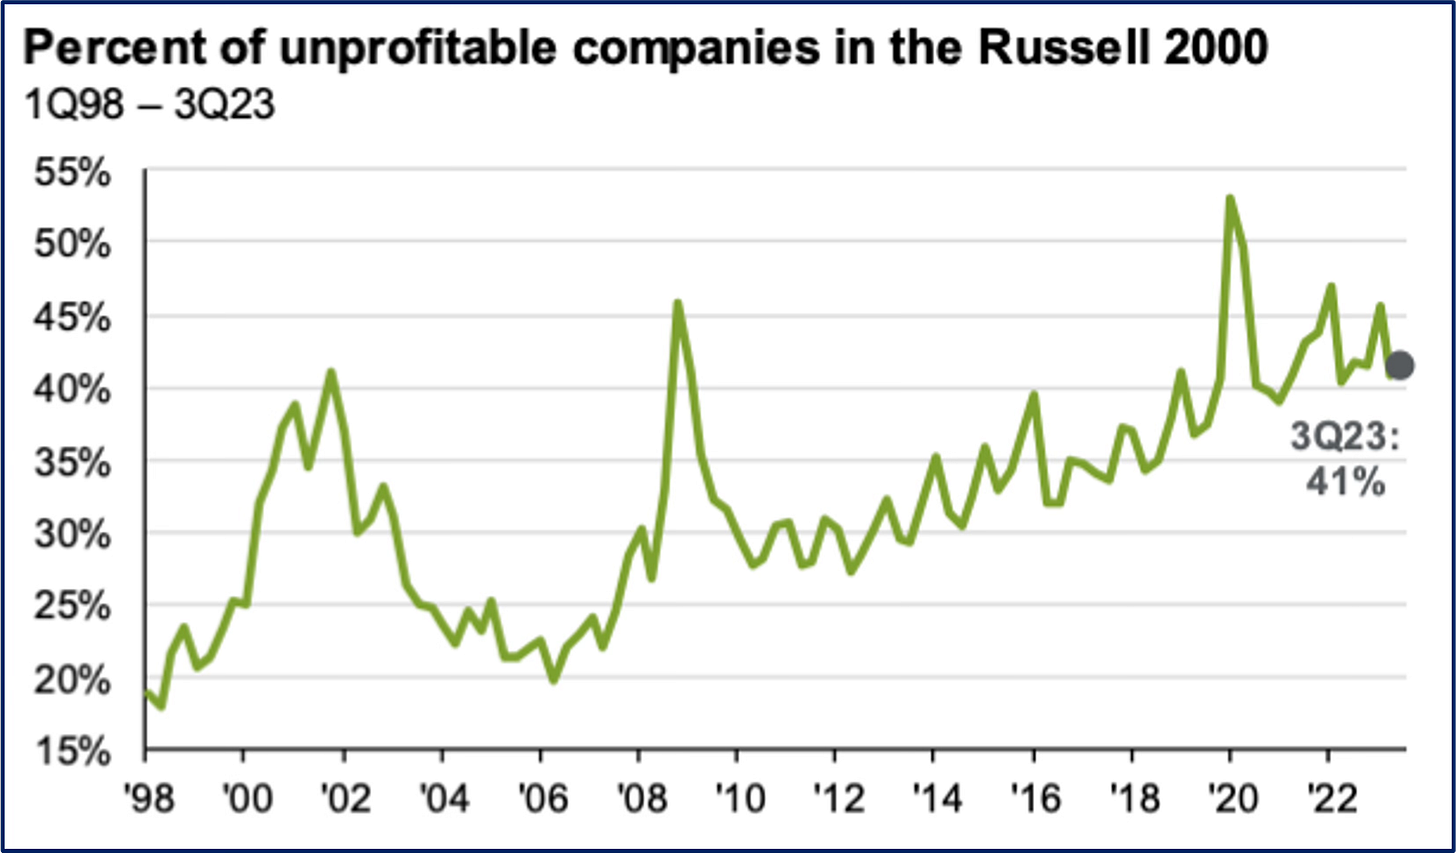
But investing in small-cap companies isn’t without its risks, and investors should keep a sharp eye out for potential minefields: 41% of the companies in the Russell 2000 are unprofitable, and earnings before interest and taxes cover a much smaller percentage of their interest expenses than among their large-cap brethren.
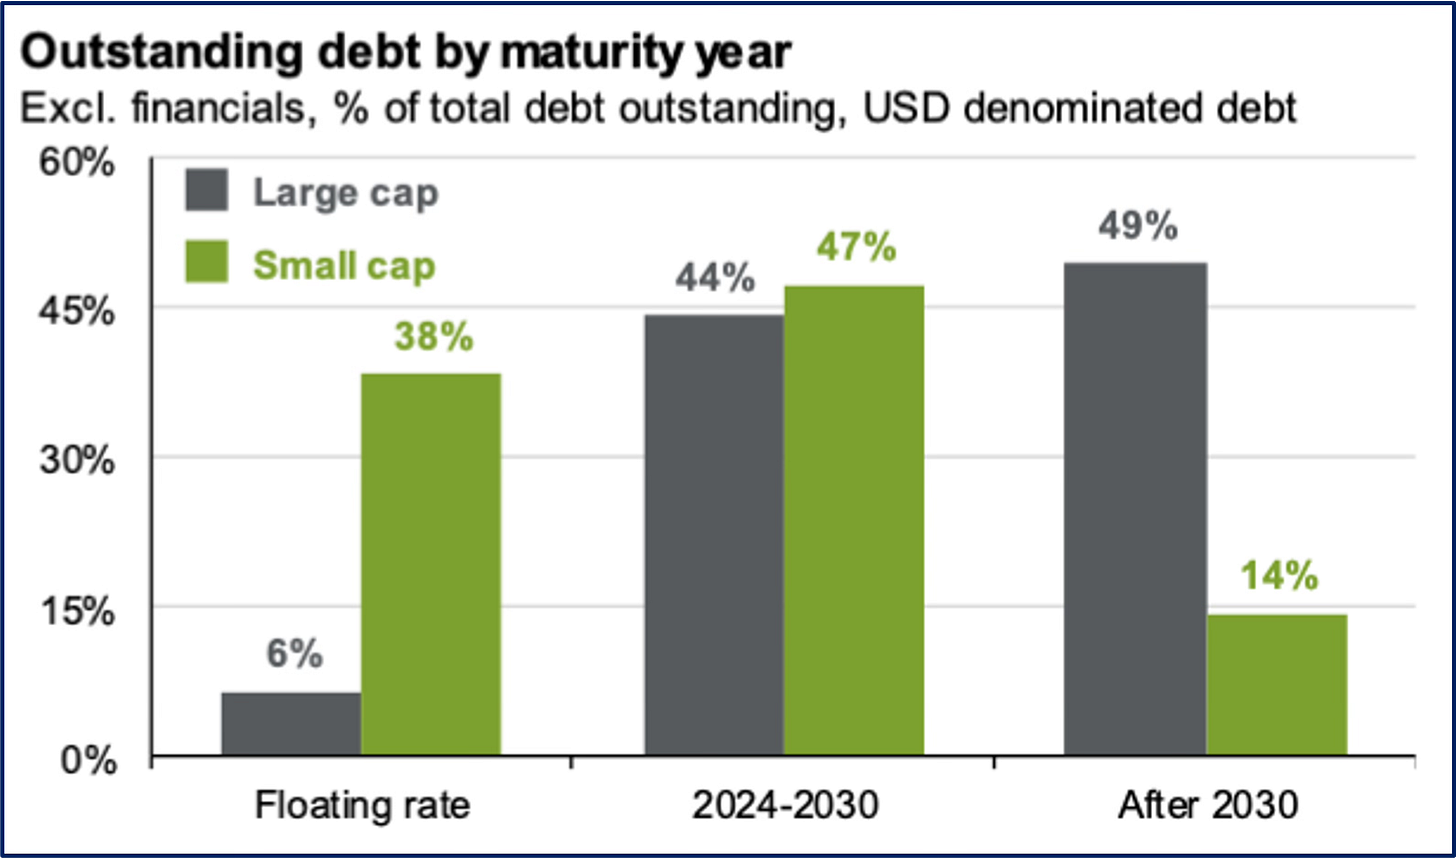
Small-caps significantly underperformed in 2023 due to a rising interest rate environment. Unlike larger-cap companies, small-cap companies are not very welcome in the long-term corporate bond market and largely get their financing from banks. In fact, 38% of small-cap debt is floating-rate, so small-caps’ interest expenses go up considerably in a rising interest rate environment like the one we just experienced. What’s more, 47% of small-cap debt comes due before 2030, so investors have been worried that fixed-rate debt coming due in the short- to medium-term will be getting more expensive still. If we do enter a period of declining interest rates, small-caps’ bottom lines would eventually benefit.
Since 2021 we have seen multiple fits and starts when small-cap shares seemed ready to resume their leadership position. The real question facing today’s investors is whether the recent rally is the real thing or a sentiment-driven head fake. Only time will tell.
The Wisdom of Taking a Long-Term View
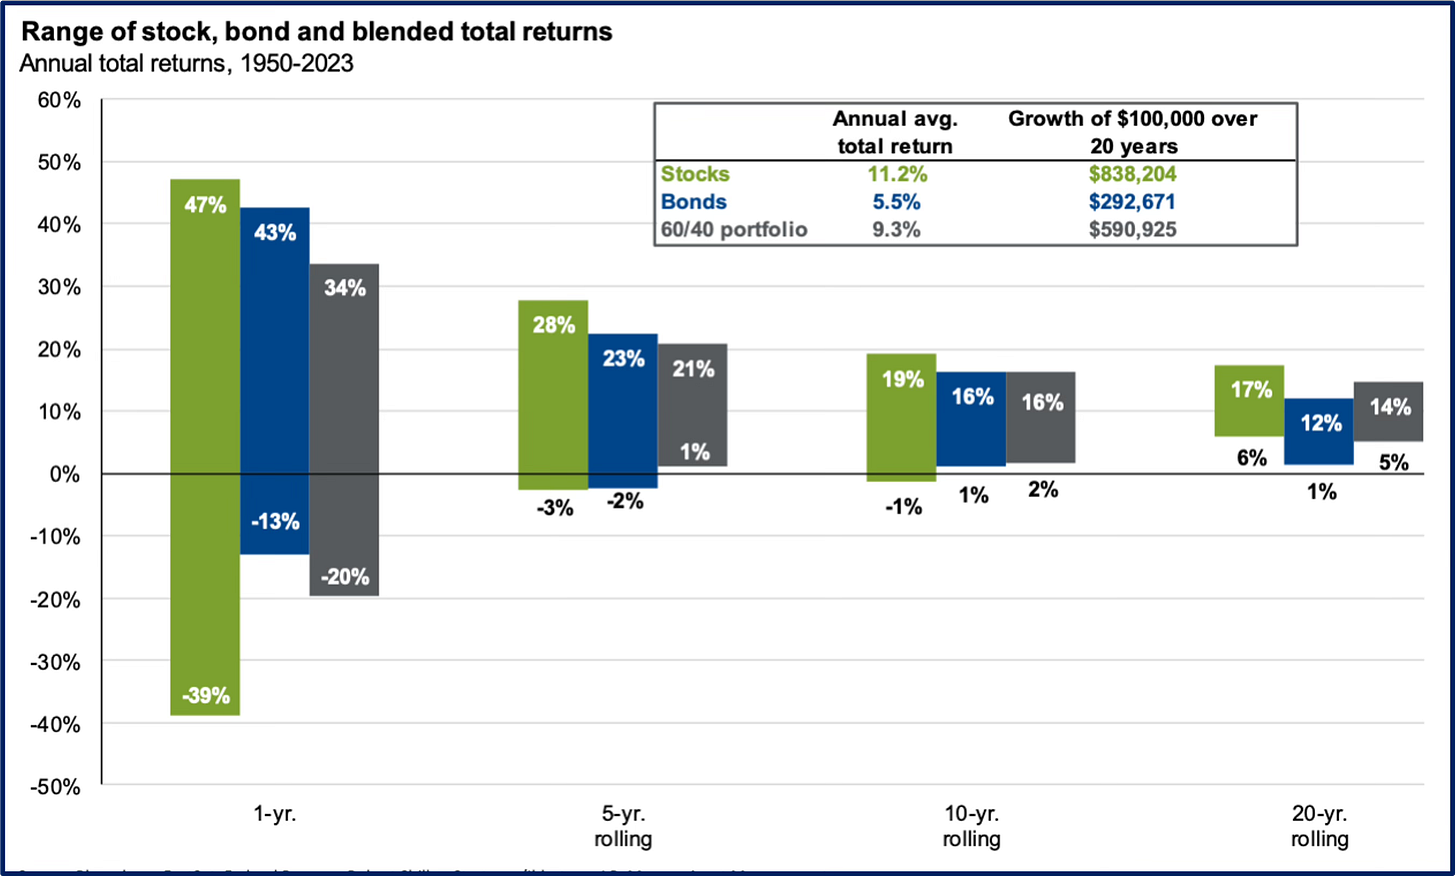
We’ve said it before, and we’ll say it again: individual investors stack the odds of investment success in their favor when they stay the course and take a long-term view. According to data from JP Morgan, since 1950 annual S&P 500 returns have ranged from +47% to -39%. For any given 5-year period, however, that range narrows to +28% to -3%—and for any given 20-year period, it is +17% to +6%. In short, since 1950, there has never been a 20-year period when investors did not average a gain of at least 6% per year in the stock market.
Past performance is certainly no guarantee of future returns, but history does show that the longer a time frame you give yourself, the better your chances become of earning a satisfactory return.
As always, we’re available to answer any questions you might have. In addition, you can reach us at Info@boyarvaluegroup.com or (212) 995-8300.
Best Regards,
Mark A. Boyar
Jonathan I. Boyar
Important Disclosures. The information herein is provided by Boyar’s Intrinsic Value Research LLC (“Boyar Research”) and: (a) is for general, informational purposes only; (b) is not tailored to the specific investment needs of any specific person or entity; and (c) should not be construed as investment advice. Boyar Research does not offer investment advisory services and is not an investment adviser registered with the U.S. Securities and Exchange Commission (“SEC”) or any other regulatory body. Any opinions expressed herein represent current opinions of Boyar Research only, and no representation is made with respect to the accuracy, completeness or timeliness of the information herein. Boyar Research assumes no obligation to update or revise such information. In addition, certain information herein has been provided by and/or is based on third party sources, and, although Boyar Research believes this information to be reliable, Boyar Research has not independently verified such information and is not responsible for third-party errors. You should not assume that any investment discussed herein will be profitable or that any investment decisions in the future will be profitable. Investing in securities involves risk, including the possible loss of principal. Important Information: Past performance does not guarantee future results. Any companies mentioned in this are for informational purposes only and the performance of the stock selected is not indicative of the performance of the stocks profiled in Boyar Research, the performance of the stocks selected, and the performance of Boyar Research may in fact diverge materially.
This information is not a recommendation, or an offer to sell, or a solicitation of any offer to buy, an interest in any security, including an interest in any investment vehicle managed or advised by affiliates of Boyar Research. Any information that may be considered advice concerning a federal tax issue is not intended to be used, and cannot be used, for the purposes of (i) avoiding penalties imposed under the United States Internal Revenue Code or (ii) promoting, marketing or recommending to another party any transaction or matter discussed herein.


